12 min
 389
389Best Crypto To Buy And Hold in H2 2025
Your quick guide to the top five cryptos showing data-backed potential for the rest of the year

So you want the “just tell me what to buy” answer 😉 But here’s the thing: there’s no crystal ball in crypto. What we can do is look at solid data and make smart, educated guesses. Right now, Bitcoin and Ethereum are holding strong, XRP and Solana are showing fresh momentum, and BNB’s fundamentals look steady. These five are worth watching through H2 2025—but remember, this isn’t financial advice. Always DYOR before you hit that buy button.
Hey there! I get why you're searching for answers in some random online article. But let's be real - there's no magic bullet here. Even top on-chain analytics firms wouldn't stake their reputation on absolute predictions. What they would do (and what we'll do here) is make educated guesses based on solid technical analysis written in plain English. Ready to dive in?
According to a Q1 2025 report from Fidelity analysts, your investing timeframe is an important factor when choosing crypto to buy and hold. How long do you plan to hodl? Short-term, mid-term, or long-term?
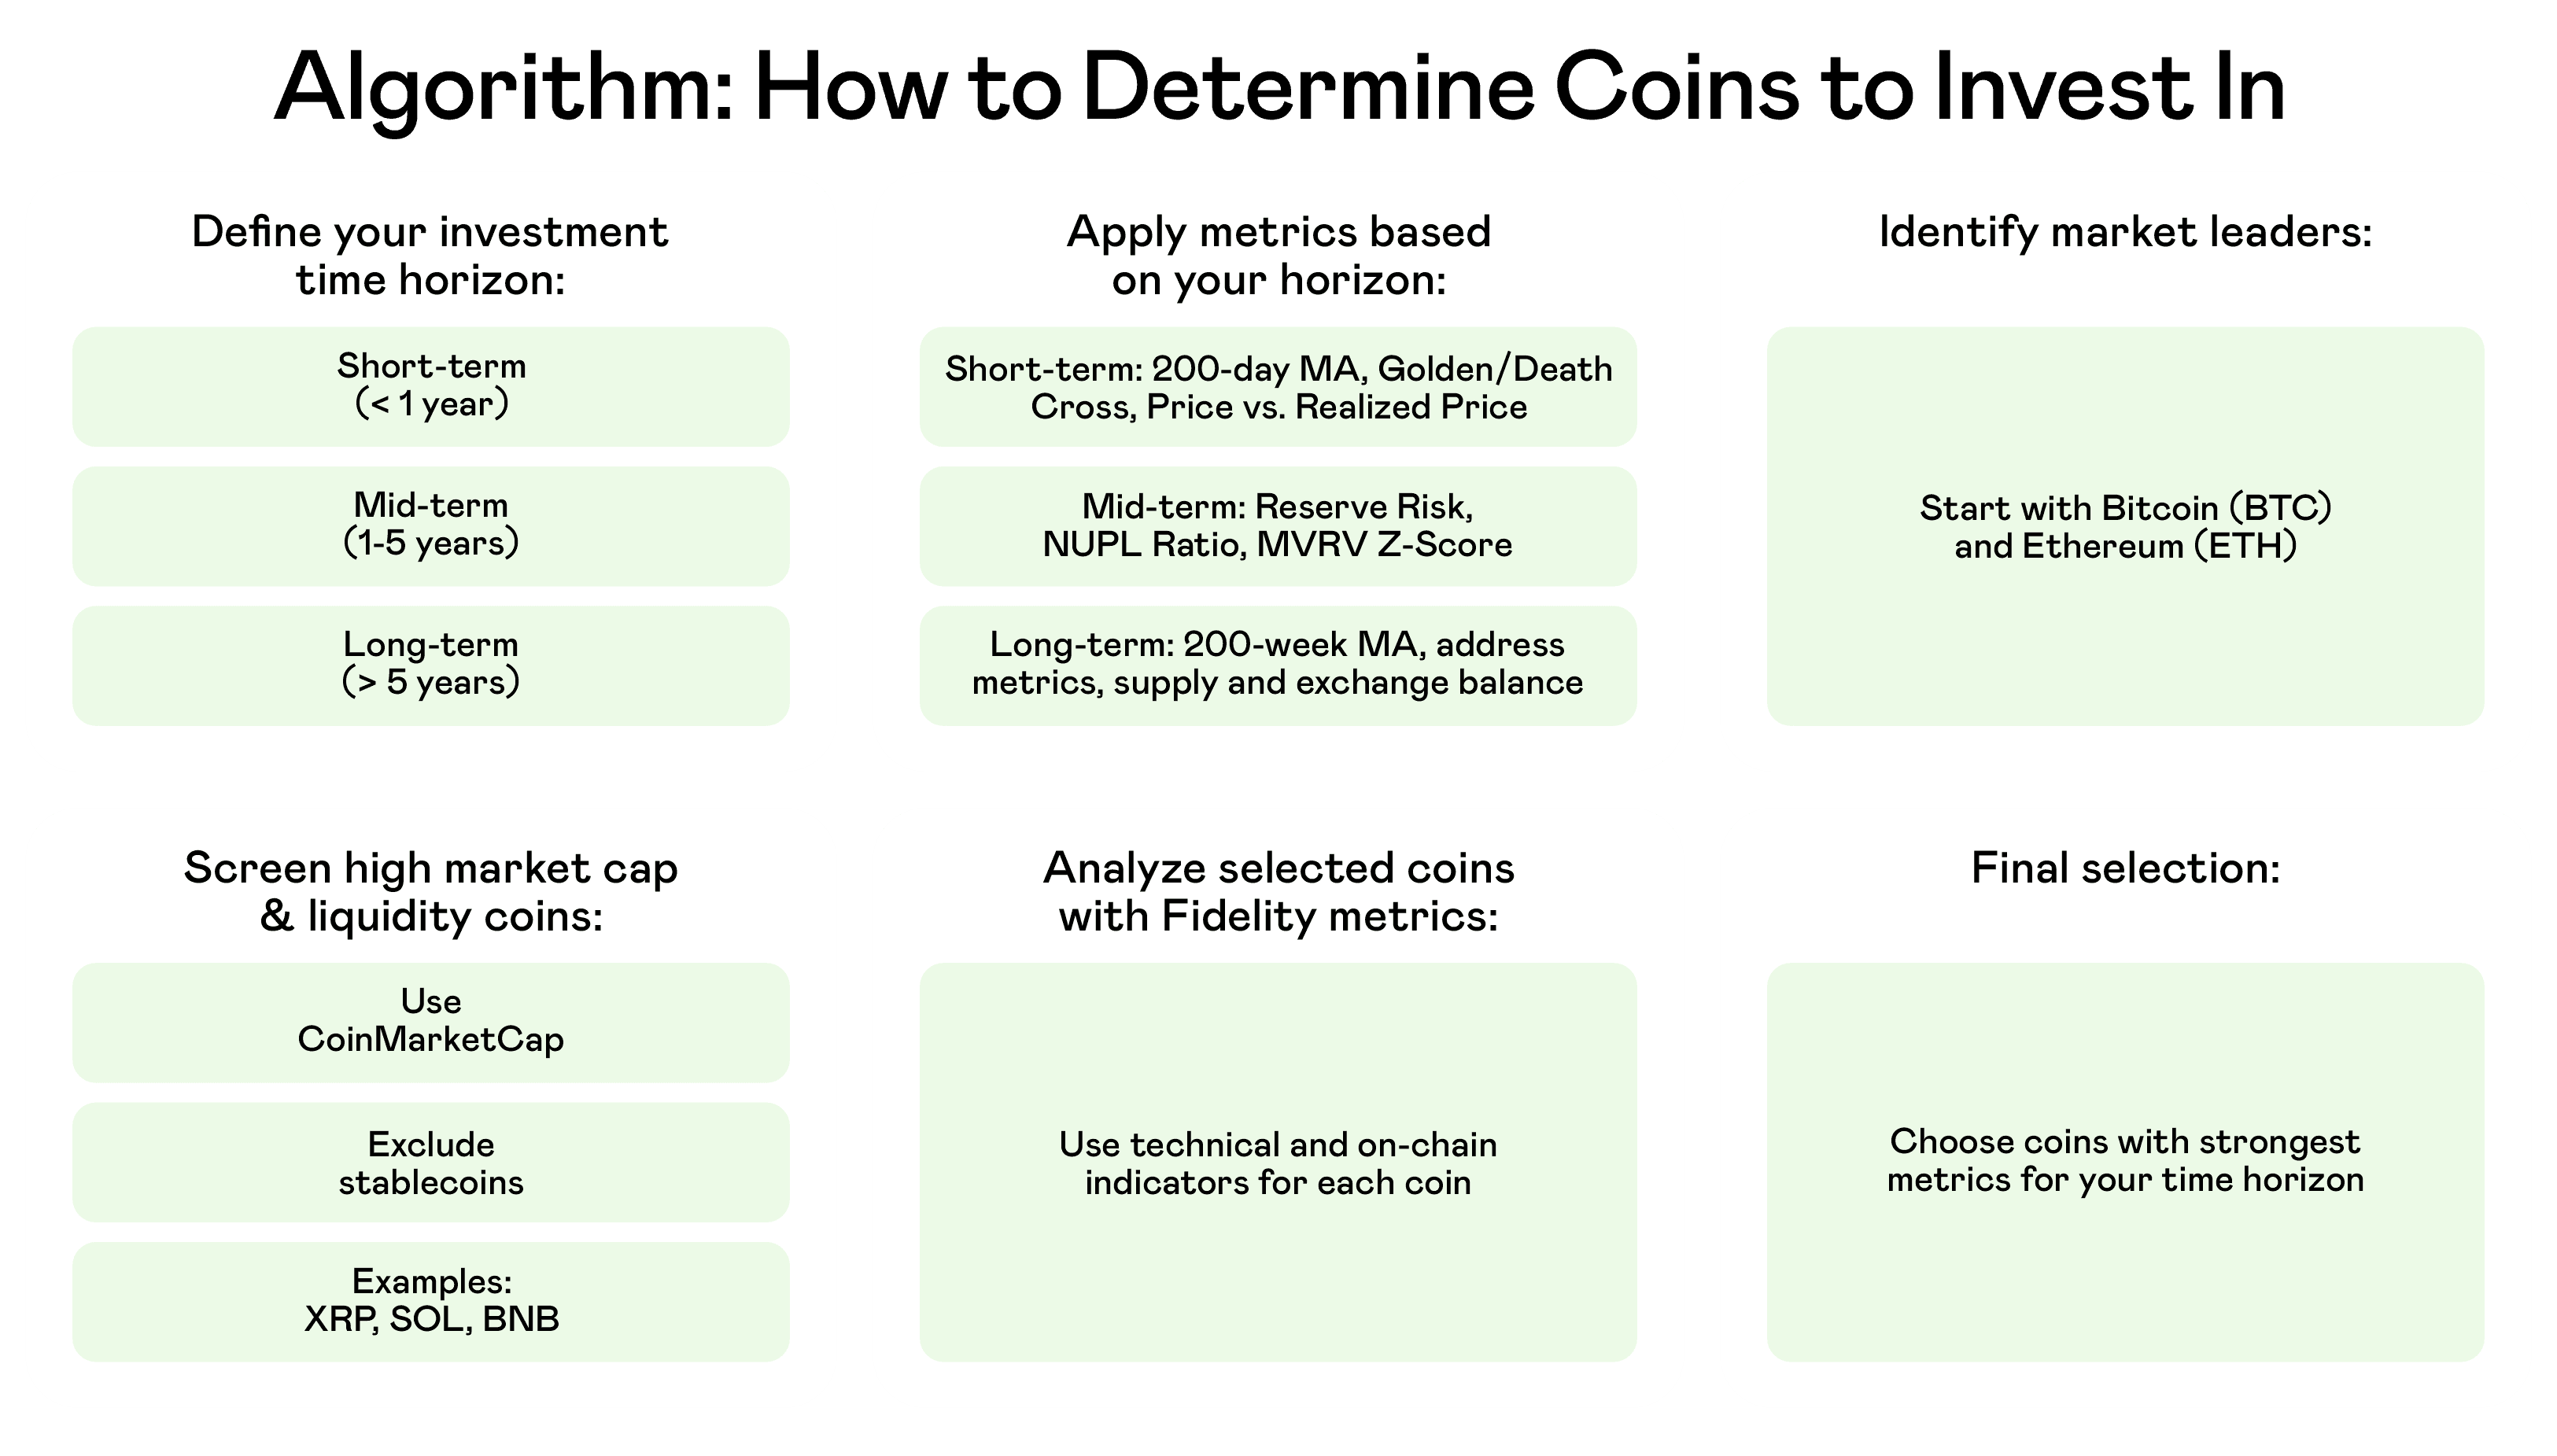
In this article, we’re focusing on the next 6 months of 2025, so we’ll rely on the short-term metrics highlighted by the analysts—like the 200-day moving average to watch for Golden Cross or Death Cross signals.
If you’re looking at a mid-term horizon, pay attention to indicators such as Reserve Risk, Addresses in Profit, the NUPL Ratio, and the MVRV Z-Score, especially on platforms like Glassnode. Keep in mind, though, that these may be behind a premium paywall.
For a long-term outlook, it’s worth tracking monthly address metrics, liquid vs. illiquid supply, exchange balances, and broader macro-economic factors.
That all sounds good, but which coins are we actually going to look at? And how do we figure out if they’re really the most promising? I spoke with three traders and asked what they’d do if they were starting from scratch with zero crypto as of July 2025. Their answer: start with the long-established leaders—Bitcoin and Ethereum—then head over to CoinMarketCap to see which coins currently have the highest market cap and liquidity. Using that approach in July 2025 (and excluding stablecoins), you’d end up with XRP, SOL, and BNB.
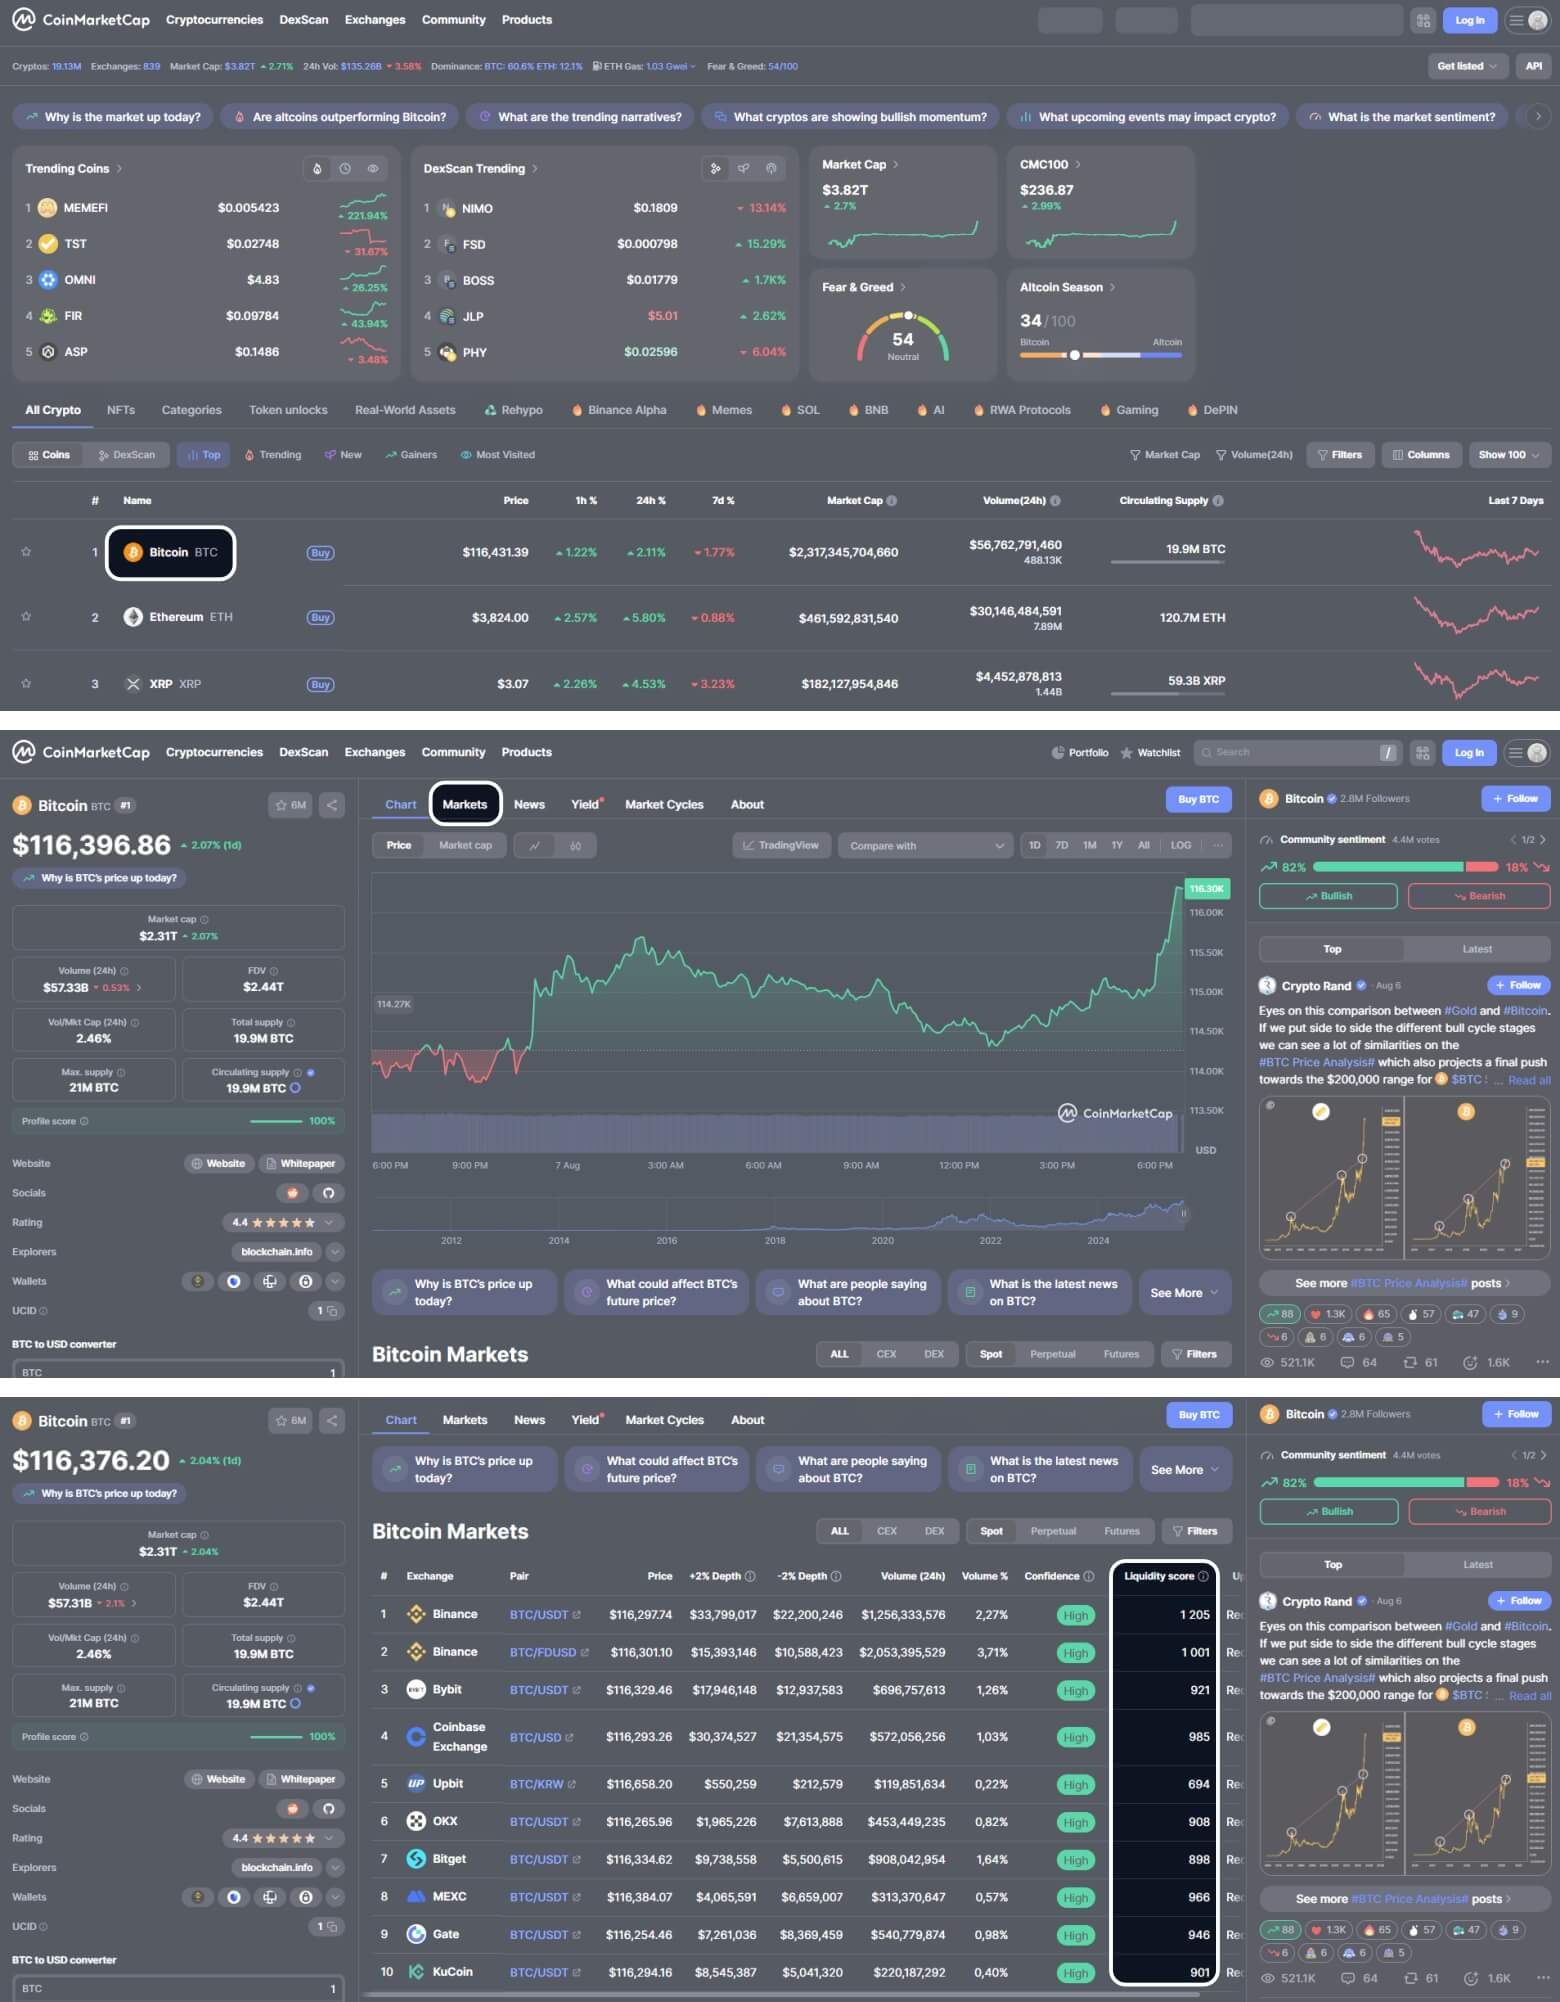
That being said, why not analyze these five coins the way top analysts at firms like Fidelity and Coinbase would, to see if those traders were right or wrong?
There are a few signals to watch if you want to track short-term market momentum (less than a year), according to Fidelity analysts. One of the signals is the Golden Cross, which is when a shorter-term trend line (the 50-day moving average) crosses above a longer-term one (the 200-day). This is usually seen as a sign that the market is turning bullish. The analysts also suggest checking if the price is above or below the 200-day line, since that often shows whether the market is leaning positive or negative. We’ll examine this for all five coins, then dive into additional indicators to sharpen the picture. Sounds like tarot card reading? Honestly? Pretty close. 😭
Best Crypto to Buy Now: Is it Bitcoin (BTC)?
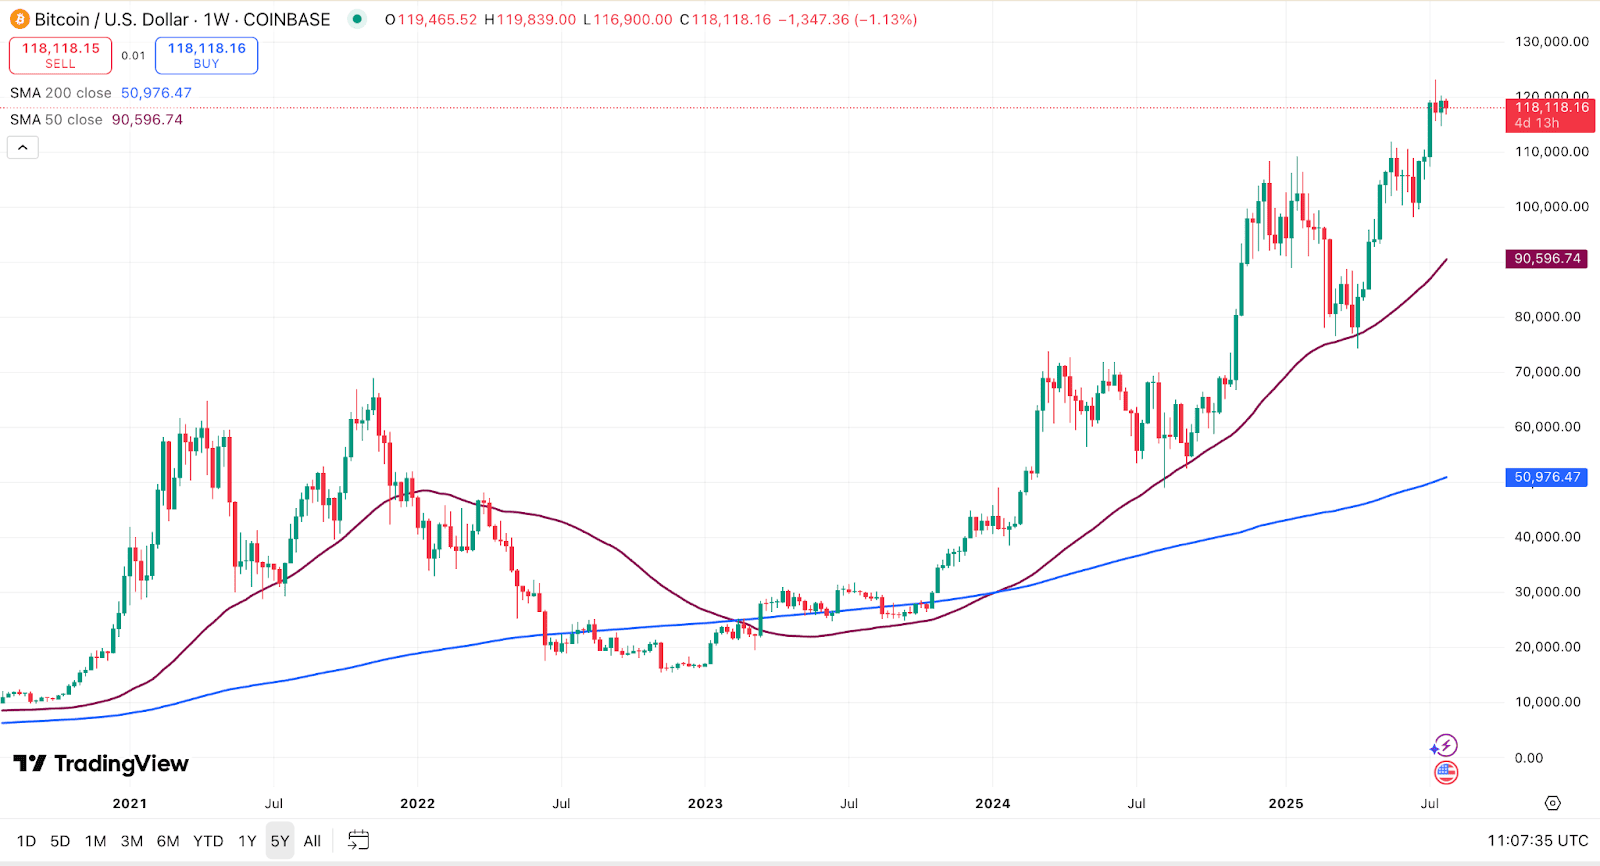
Source: TradingView, July, 30. Bitcoin stays strong above both its 50-day and 200-day moving averages, reinforcing its bullish trend heading into H2 2025
As of July 2025, Bitcoin is showing strong momentum—it’s trading well above both its short-term and long-term trend lines (the 50-day and 200-day moving averages). That’s a good sign: in the past, when Bitcoin stayed above these lines for a while, it often went on to grow even more. Of course, things can change if the price suddenly drops below the short-term line, but for now, the overall picture looks healthy and optimistic.
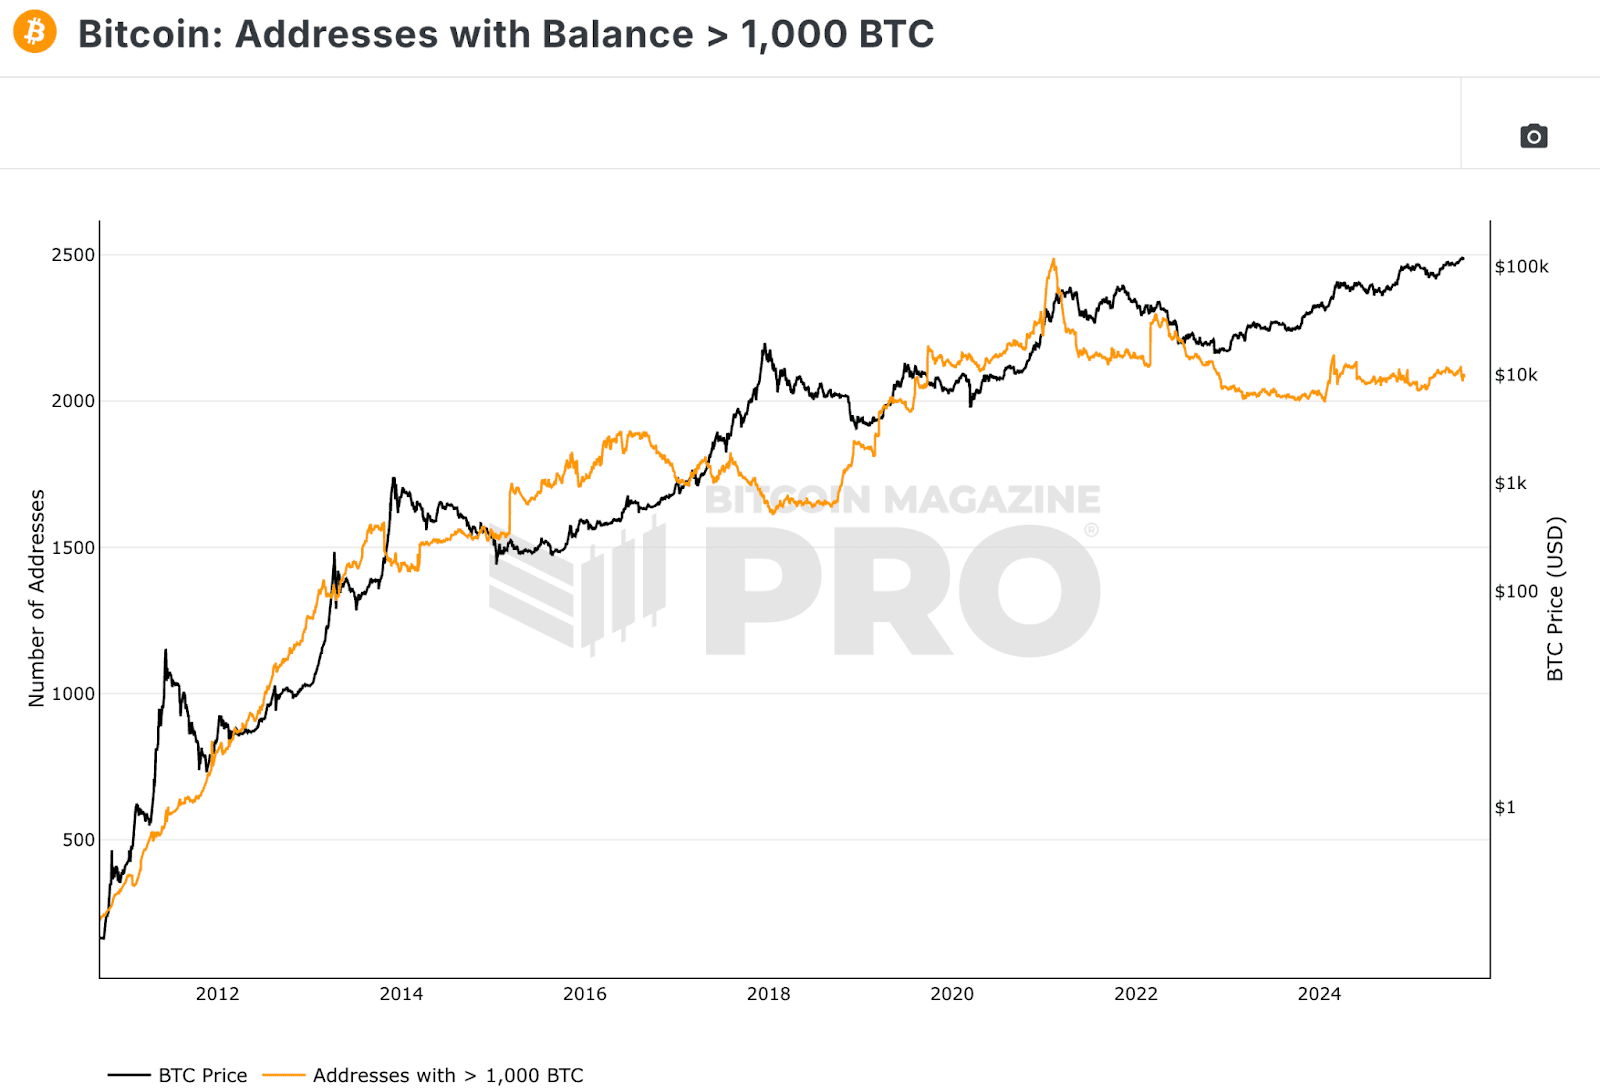
Source: Bitcoin Magazine Pro, July, 31. The number of Bitcoin wallets holding over 1,000 BTC has stayed high through 2025, reflecting steady confidence from large holders and reducing near-term selling pressure
In their Monthly Outlook Report, Coinbase analysts highlight the importance of tracking the rise in BTC wallets with balances of $1M or more. This metric helps assess whether large holders are accumulating or reducing exposure, which is a useful signal for spotting potential market liquidations or a major sell-off in the near future.
From early 2024 to mid-2025, the number of Bitcoin addresses holding over 1,000 BTC has remained consistently high, stabilizing around the 2,000–2,100 range. This shows that large holders— the “whales”—have mostly been in hold mode, neither aggressively accumulating nor distributing their BTC.
Historically, periods where whale addresses hold steady at elevated levels during price consolidations often set up for mid-term upward moves. The flat but elevated number of high-balance addresses points to ongoing accumulation and strong market support, reducing the risk of forced selling. If this stability continues while Bitcoin holds above the 200-day SMA, it signals healthy market structure heading into H2 2025, though a sharp drop in whale addresses would remain a warning sign to watch closely.
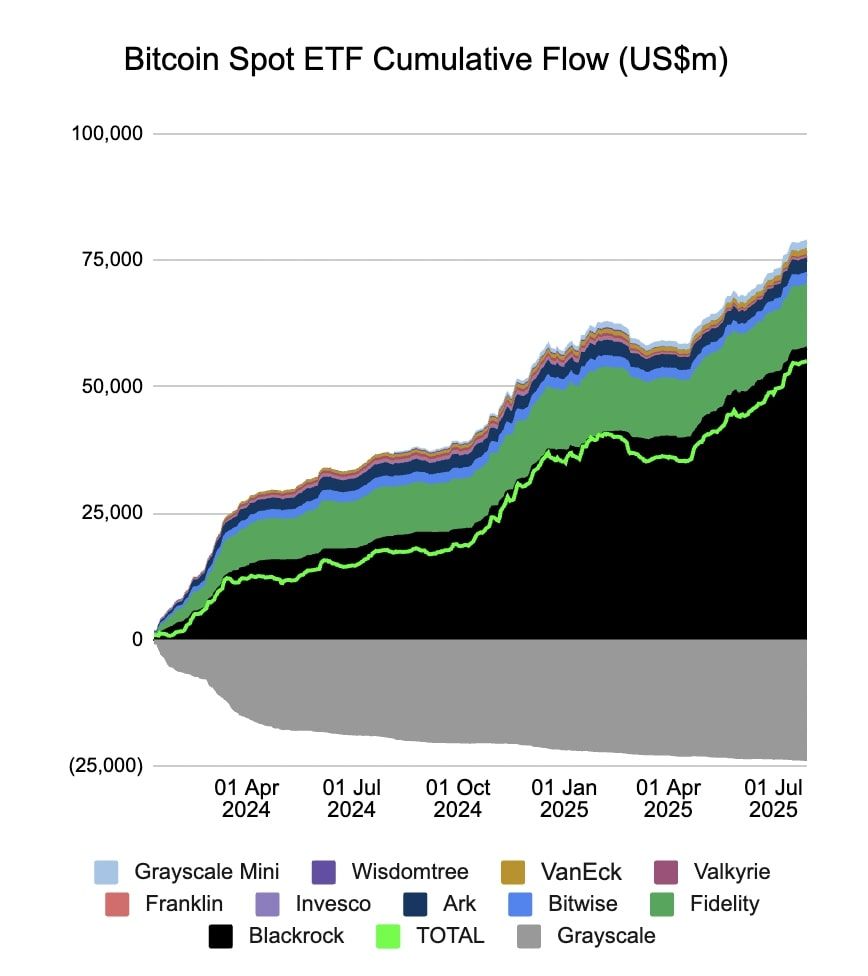
Source: Farside, July, 31. Bitcoin Spot ETF inflows have climbed steadily to over $75B by July 2025 driven largely by BlackRock and Fidelity, underscoring strong institutional demand and a supportive price floor
According to Messari analysts, Bitcoin ETFs were a key structural driver for BTC in 2024. And as we can see, that trend has continued through July 2025. From January to July 2025, over $75 billion flowed into Bitcoin ETFs, showing strong interest from both everyday investors and big institutions. Most of this came through BlackRock’s ETF (IBIT), highlighting steady institutional support.
There have been no major outflows, which lowers the risk of sudden drops. Historically, when ETF inflows stay strong during price consolidations, Bitcoin often rallies within a few months. If this trend holds and BTC stays above the 200-day moving average, the outlook for the rest of 2025 looks solid.
Ethereum (ETH): Is it too late to buy?
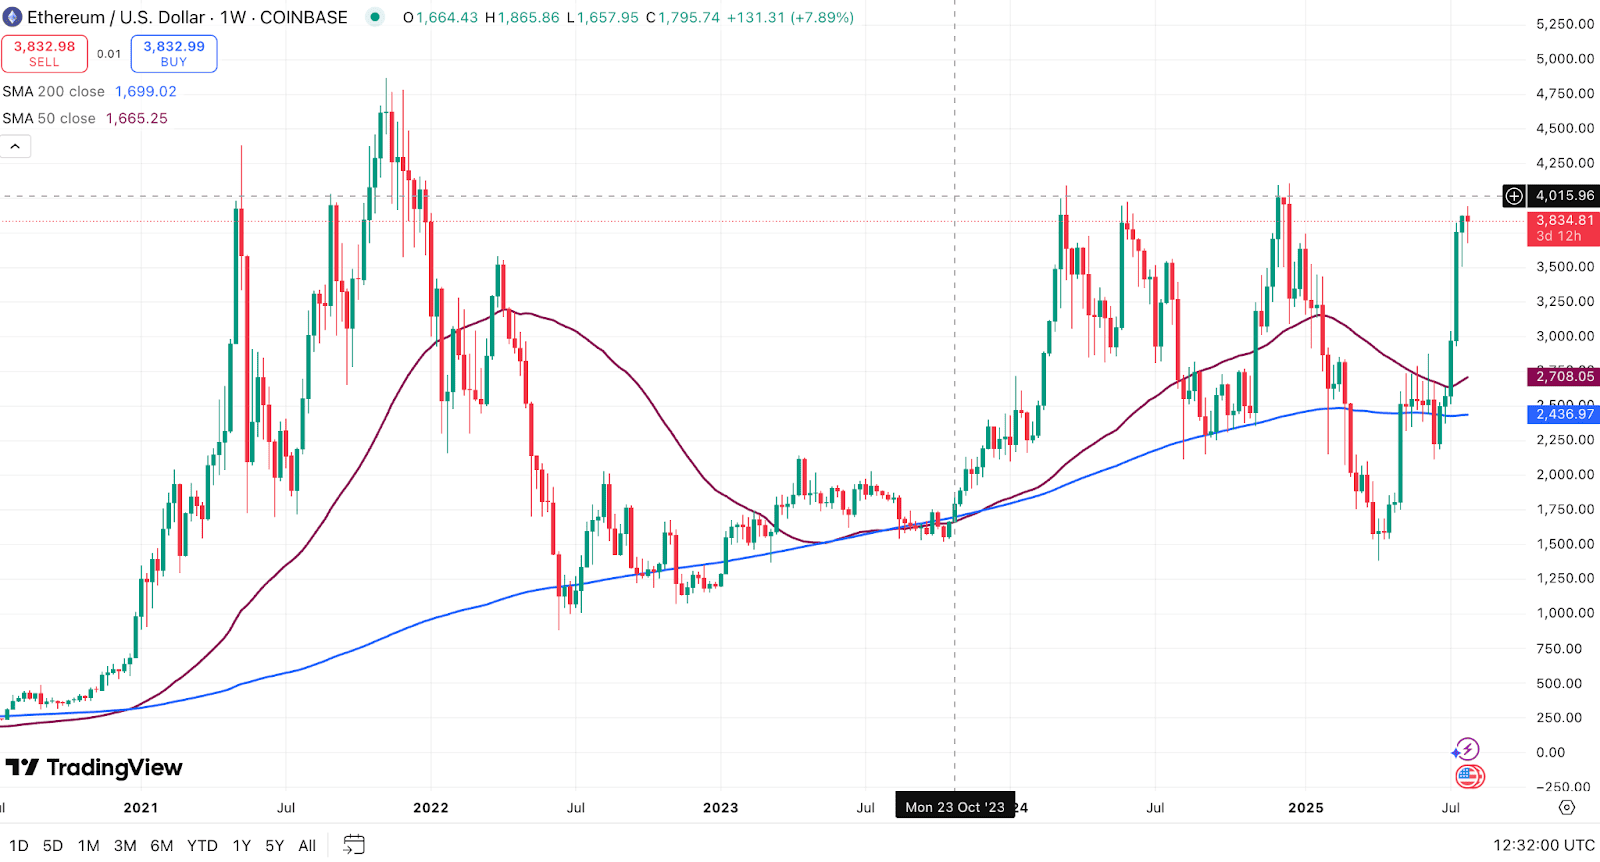
Source: TradingView, August 1. Ethereum has surged toward $4,000 after breaking above its key moving averages, signaling renewed strength as it heads into the second half of 2025
Take a look at the chart, and you’ll see that Ethereum has been on a strong upswing recently. It’s now sitting well above both its 50-week and 200-week moving averages, which is a positive sign, just like in case with Bitcoin.
Right now, the coin is testing the $4,000 area—a spot where it’s faced resistance before—but the overall trend looks encouraging. Even if there’s a small pullback, staying above those key averages would keep things on track.
Bottom line: Ethereum is entering H2 2025 with technical tailwinds at its back. The only thing to watch closely? A sudden slip back under the short-term average (around $2,700) would weaken this bullish setup fast.
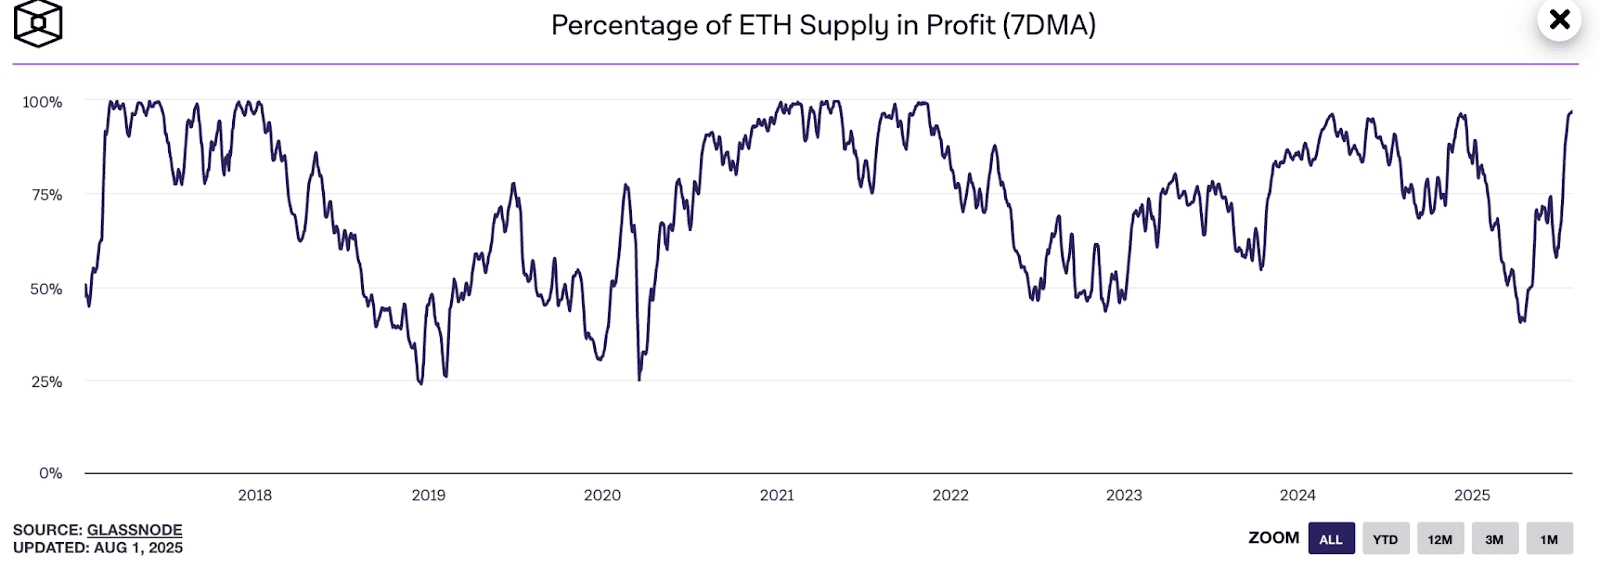
Source: Glassnode as presented on The Block, August 1. The share of ETH supply in profit has surged back toward 90%, marking one of its strongest rebounds since early 2024 and signaling renewed market confidence heading into H2 2025.
The analysts also love this other metric—look at the chart above. Ethereum’s profit levels have jumped over the first half of 2025, which basically means that most holders bought their coins at a lower price than ETH is worth today. This often happens before bigger price moves.
When more people are in profit, they’re less likely to sell out of fear or frustration, which helps keep the price from dropping. At the same time, seeing so many holders in profit can attract new buyers who don’t want to miss out, which pushes demand higher and can drive the price up even more.
Right now, Ethereum’s trend looks healthy, and there’s still space for it to grow before hitting levels that have signaled peaks in the past. If it can hold steady near its current range and keep this momentum going, it has a good shot at reaching the $4,500–$5,000 zone over the next few months. The main thing to watch is whether it can rise at a steady pace without spiking too fast. So far, though, the second half of 2025 is shaping up to look promising for ETH.
Ripple (XRP): The Comeback Coin With Fresh Momentum
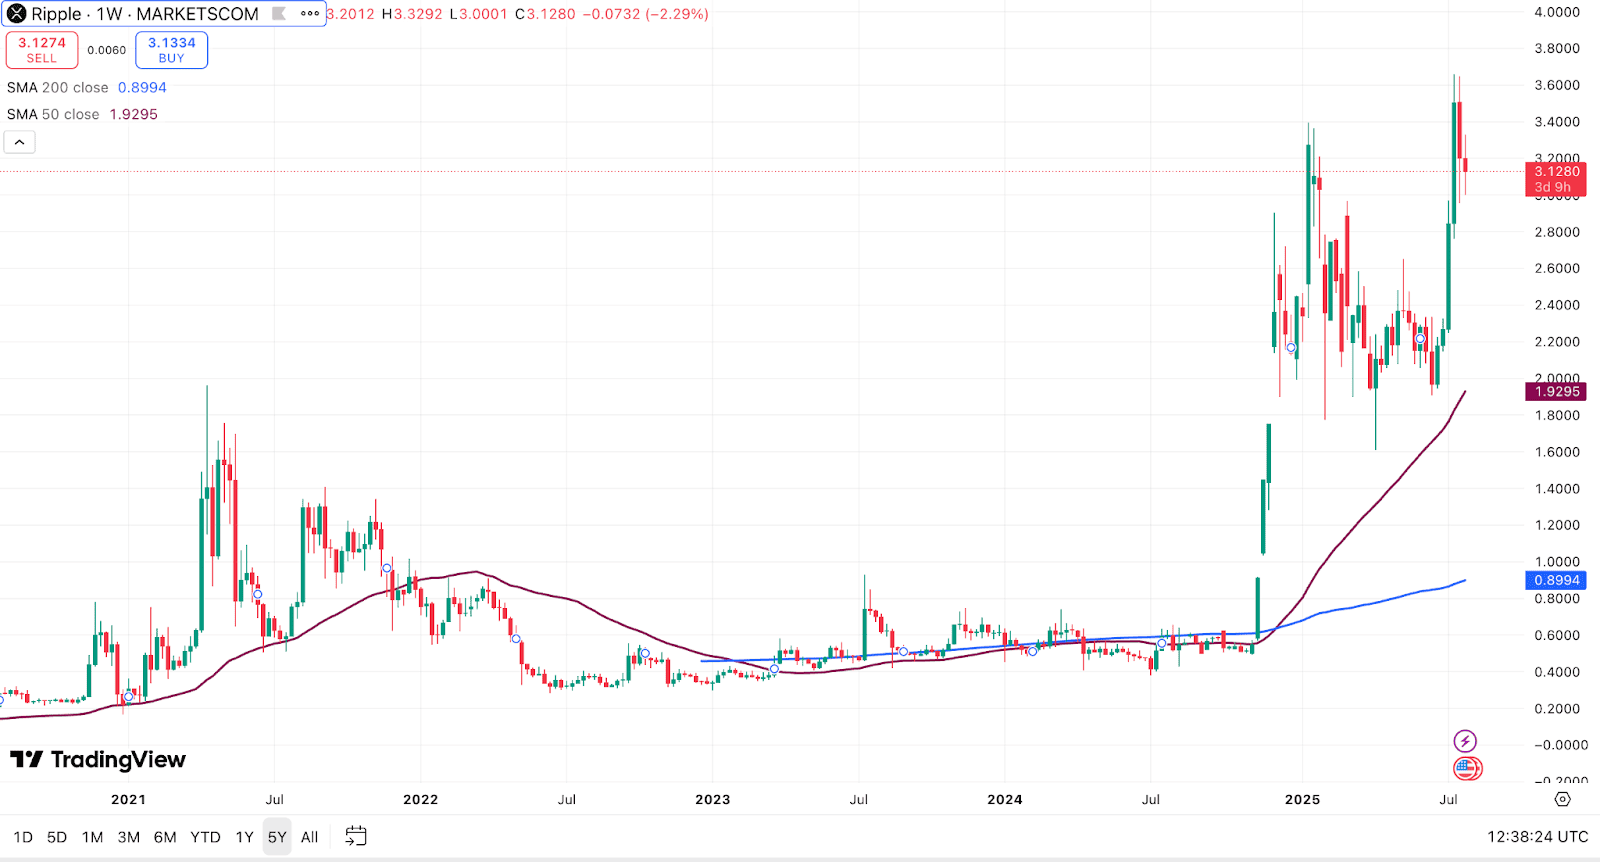
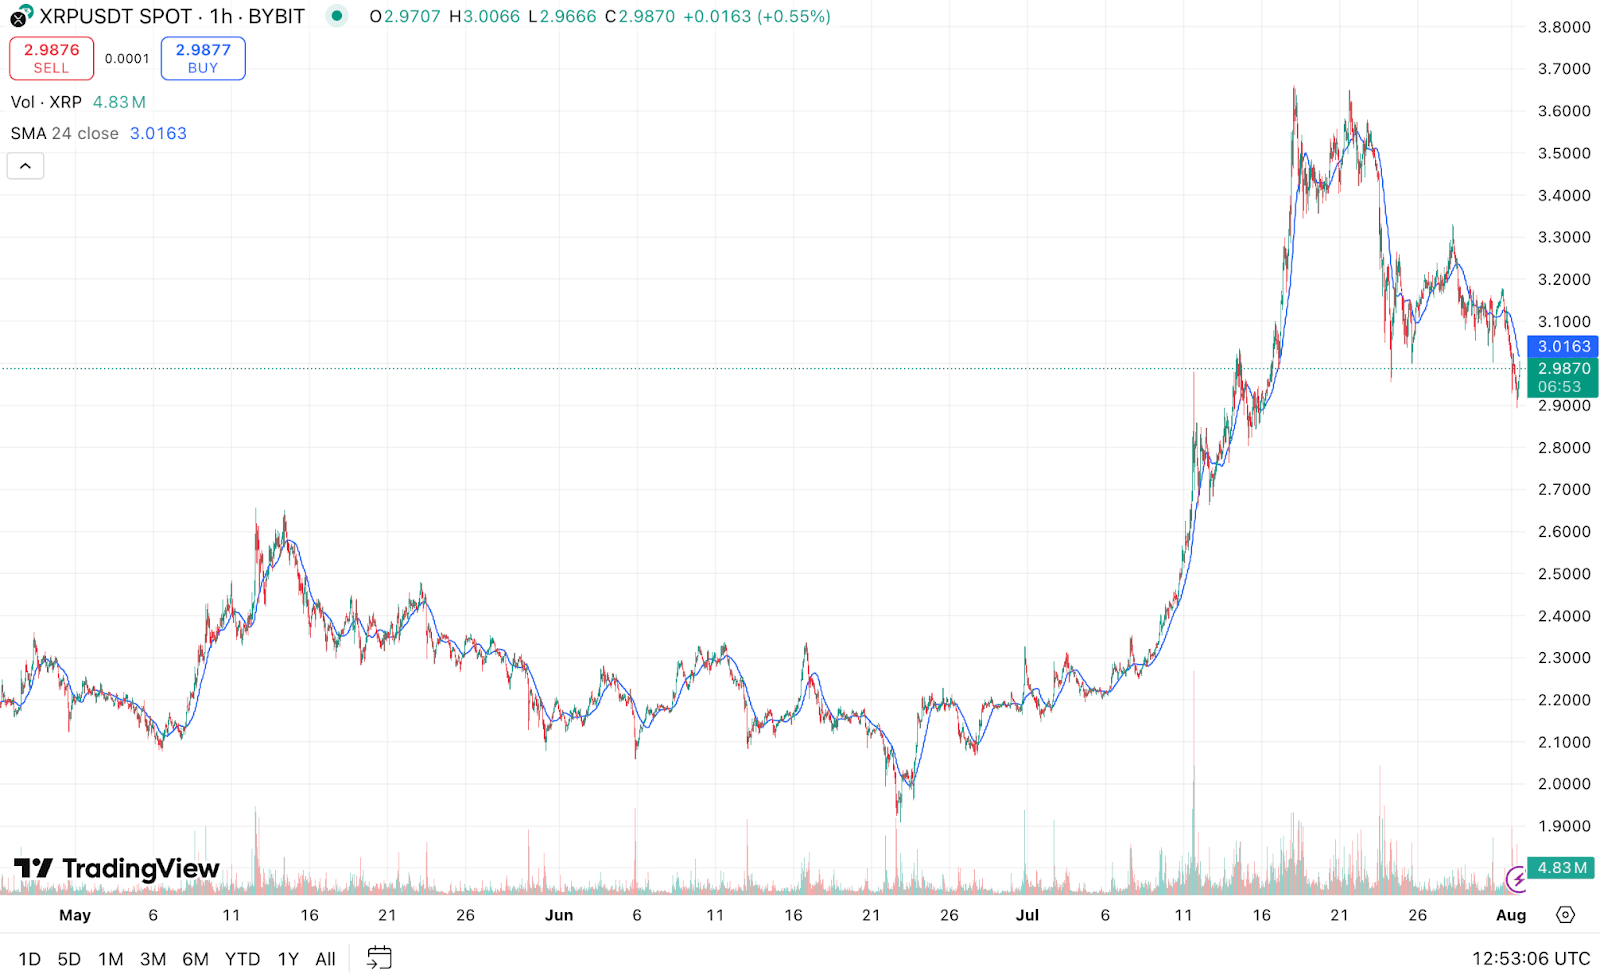
Source: TradingView, July 31. XRP has climbed above key long-term trend lines and is holding near $3 after a sharp rally, signaling strong momentum heading into the second half of 2025.
The institutions’ favourite kid, XRP has had a strong comeback this year, finally breaking out of the slow, flat trading it’s been stuck in for a long time. It’s now holding above two important long-term trend markers, which is usually a good sign that its rise isn’t just a quick jump but part of a bigger shift.
Right now, XRP is sitting just above $3, a level where it’s run into some resistance. It’s normal to see prices pause or dip a little after such a fast climb, but as long as it stays above its recent support levels, this upward trend is likely to continue.
If XRP can settle around where it is now and keep this steady pace, it has a solid chance of moving higher again in the second half of 2025. The key thing to watch is whether it can stay stable during any small pullbacks, because that would show its recent momentum is holding strong.
Source: TradingView, August 1. XRP surged from $2.00 to nearly $3.70 in July before easing back toward $3.00, forming a consolidation that could set the stage for its next move in H2 2025.
Again, this chart shows that the coin’s rally through July has been one of its sharpest in recent months, climbing from around $2.00 to nearly $3.70 before easing back toward $3.00. According to the kind of framework used by CoinMetrics analysts, this pattern—strong upward momentum followed by a cooling-off period—is often a sign of healthy profit-taking rather than a breakdown in trend.
What matters now is whether XRP can stay around $3.00. If it does, it shows buyers are stepping in to keep it from falling, which could set it up for another move higher later in 2025. CoinMetrics analysts often see this pattern—big jumps followed by steady support—as a strong sign for the next rally, as long as trading stays active and confidence holds.
SOLANA (SOL): From Choppy Waters to Steady Growth
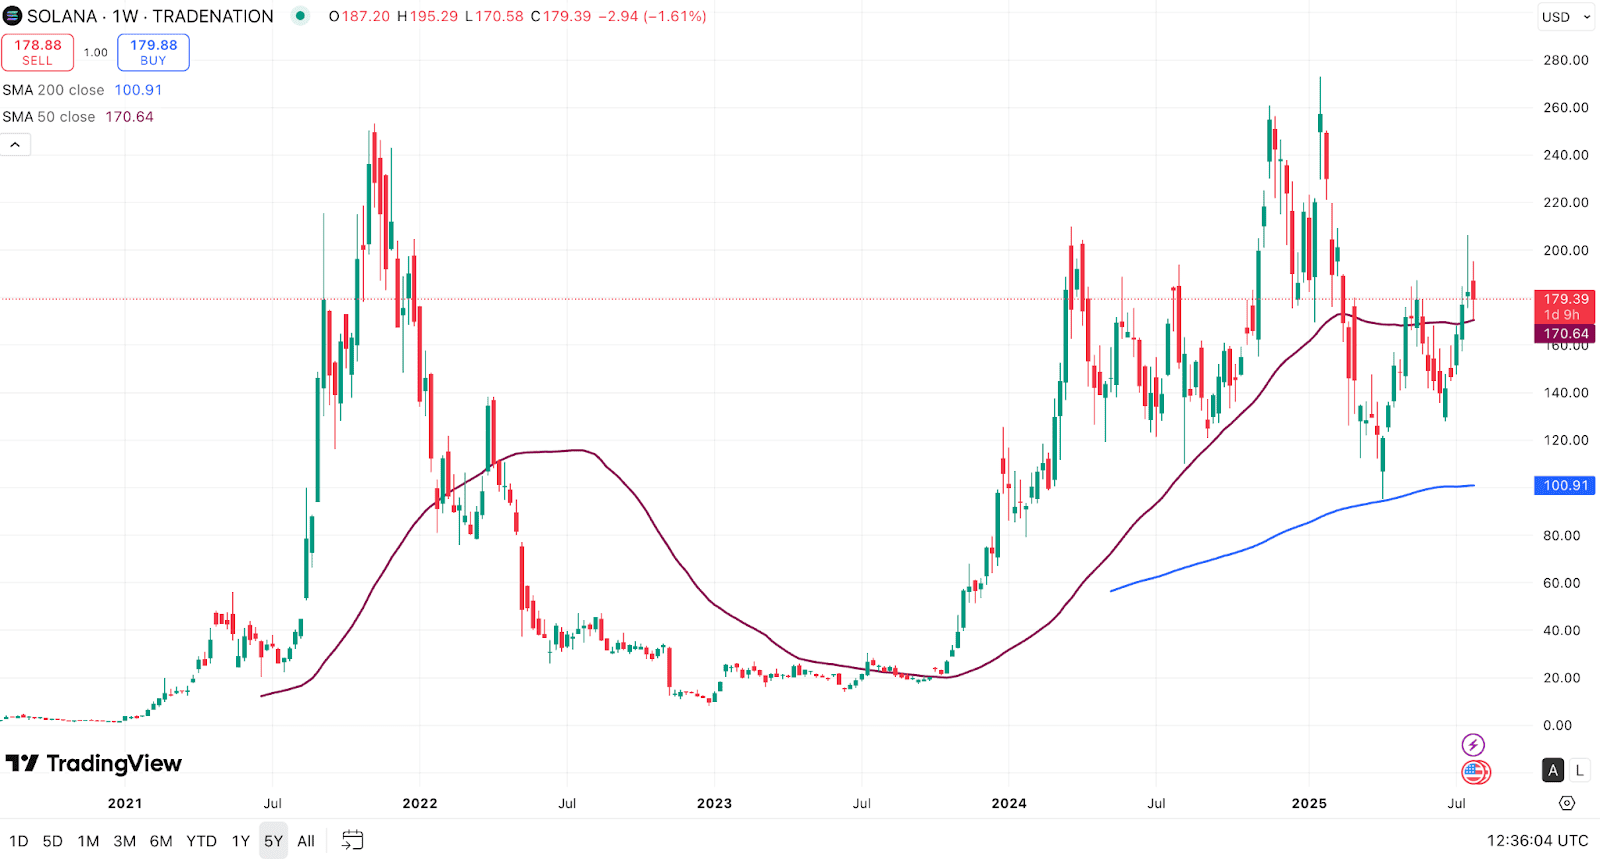
Source: TradingView, August 1. Solana is holding near $180 after bouncing from its 50-week average, signaling renewed strength following months of choppy trading.
After slipping earlier in the year, Solana climbed back from around $140 and is now sitting near $180. It’s also holding above a key trend marker that often acts like a “safety net” for its price. Moves like this—where it recovers from a dip and settles in—are usually a sign that buyers are coming back and confidence is improving.
If Solana can keep steady around where it is now, it would suggest that the earlier drop was more of a pause than anything serious. This lines up with how CoinMetrics analysts look at these kinds of patterns: when a coin holds firm after a pullback, it often sets the stage for the next push higher, as long as people stay active and interest doesn’t fade.
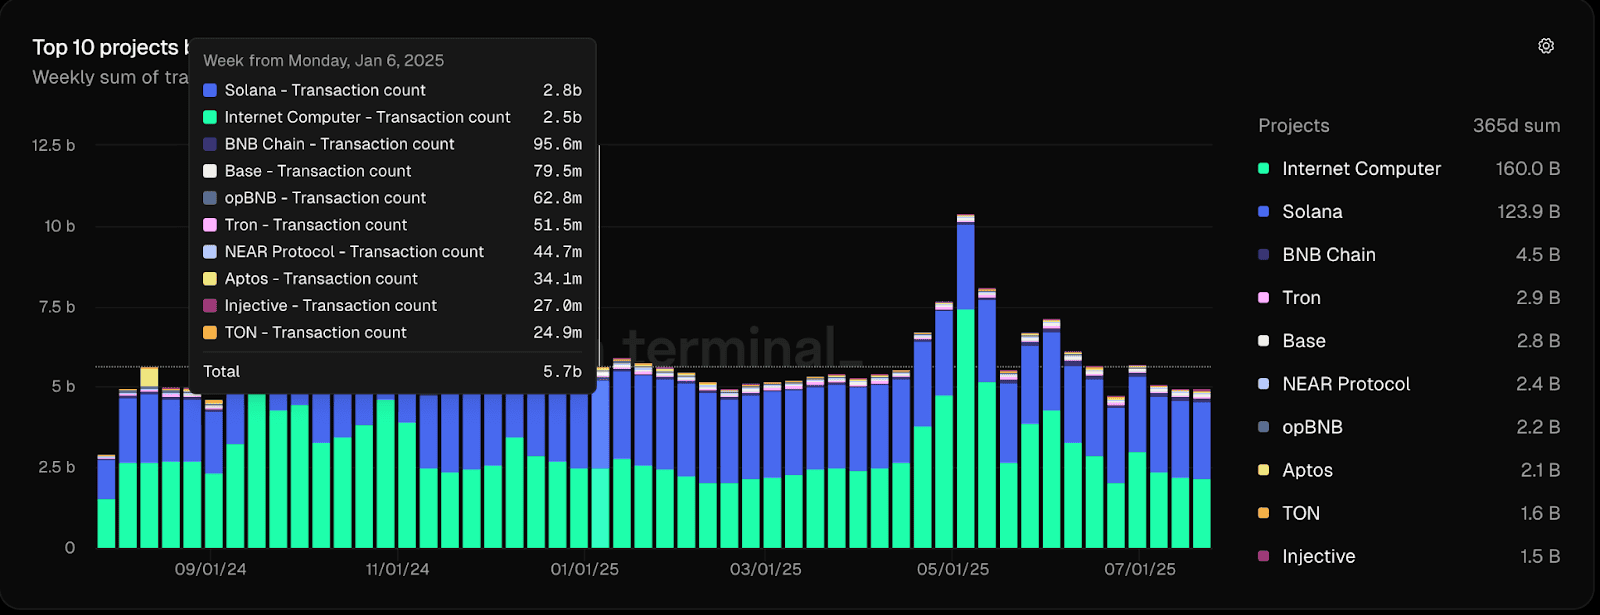
Source: Token Terminal, August, 1. Solana maintained over 120B transactions in the past year, reinforcing its position as one of the most actively used blockchains, with steady weekly volumes even after May’s activity spike.
As to its transaction activity, Solana remains one of the strongest in the space, holding steady near the top despite some volatility earlier in the year. Using the lens Fidelity analysts apply to network usage, this consistency signals that Solana isn’t just riding short-term hype—it has a stable base of users driving transactions week after week.
The spike in May, followed by a return to solid levels, is exactly the kind of pattern analysts see as healthy: bursts of activity tied to catalysts—like new app launches or ecosystem events—followed by a sustained floor rather than a sharp drop-off. Over the past 12 months, Solana has logged over 120 billion transactions, second only to Internet Computer, reinforcing its position as a core high-throughput network.
If this steady pace continues and future upgrades or app launches push volumes higher, it would support the idea that Solana’s growth is grounded in real usage, not just short-term incentives. For Fidelity-style network analysis, this is exactly the type of signal that points to lasting adoption momentum rather than speculative swings.
Binance Coin: Slow and Steady With Solid Fundamentals
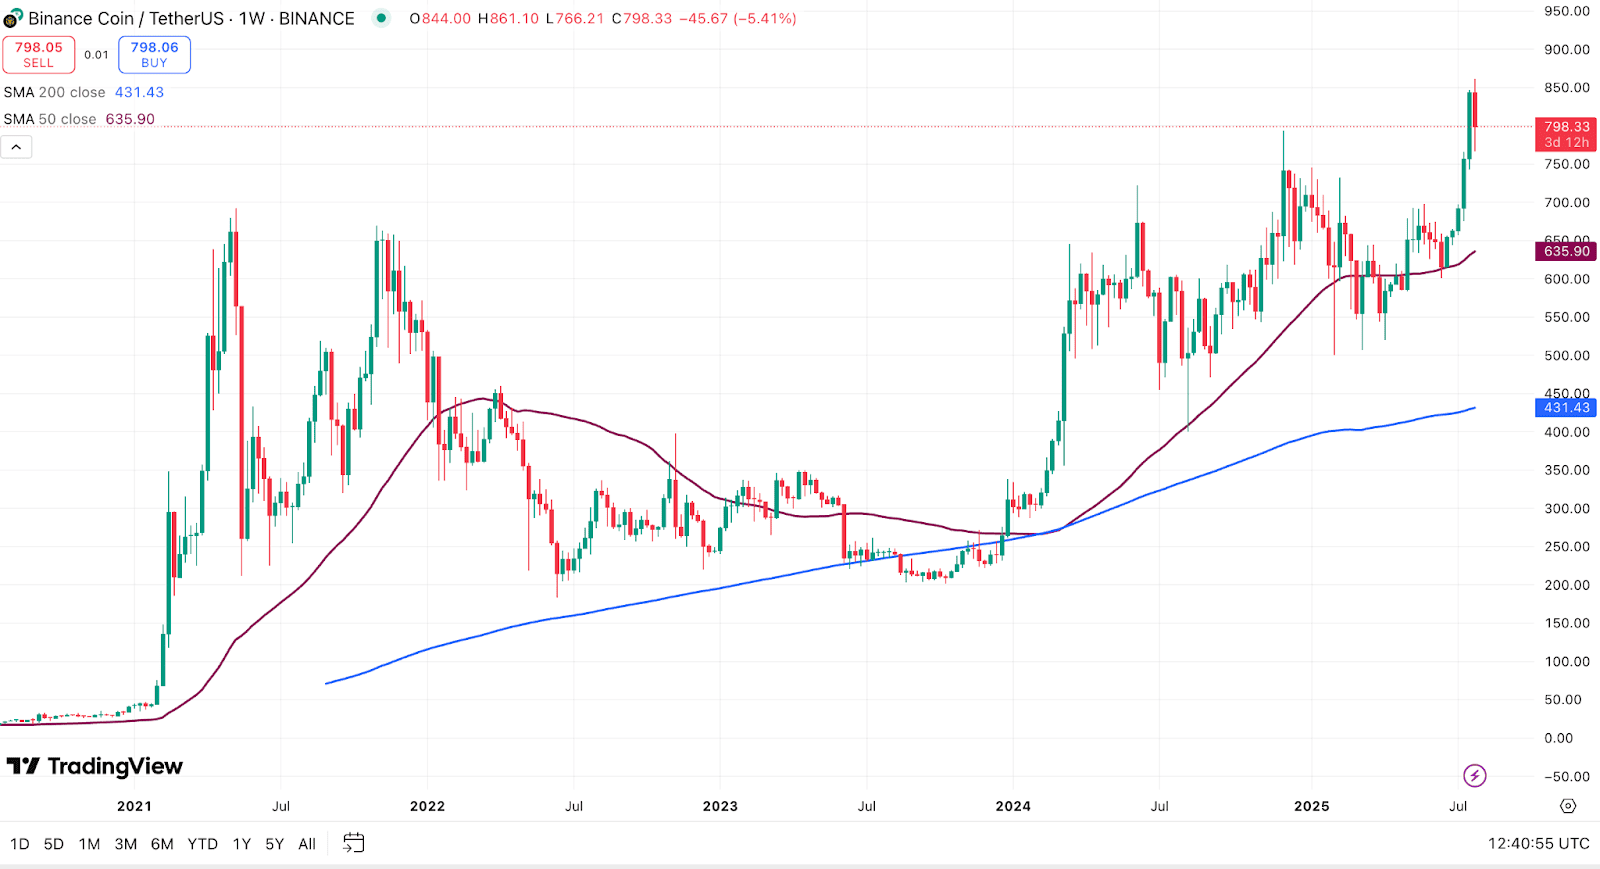
Source: TradingView, July, 31
BNB has been on a steady climb, breaking past levels it hadn’t touched in over a year and moving well above its key trend lines. After reaching a high near $860, it’s pulled back slightly to around $800, which is common after a strong run like this.
Even with this dip, it’s still sitting comfortably above its recent support zone and both its 50-week and 200-week averages. That suggests the broader trend is intact and this move isn’t just a short-lived spike.
If BNB can hold near its current levels and avoid slipping back under support, it’s in a good position to keep building on this momentum in the second half of 2025. The real test will be whether it can stabilize here and turn this brief pause into a base for the next move higher.
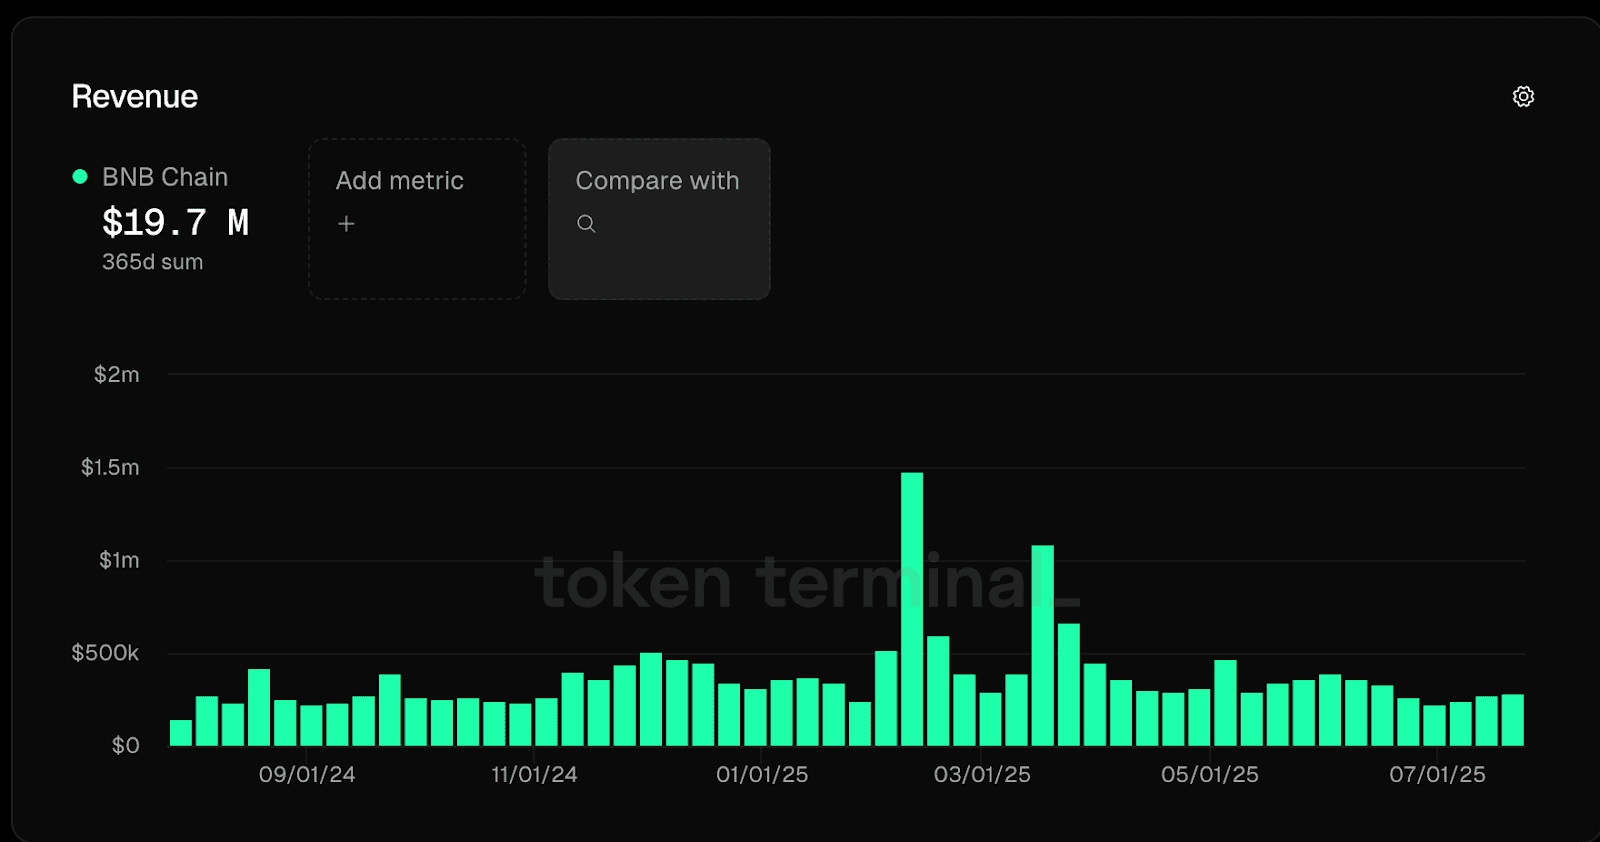
Source: Token Terminal, August 1. BNB Chain has generated $19.7M in revenue over the past year, with occasional spikes linked to periods of heightened network activity.
Interestingly, BNB Chain’s revenue—the fees generated by the network when people use it—has stayed relatively steady over the past year, with a few sharp jumps early in 2025 that coincided with noticeable boosts in network usage. These spikes likely reflect bursts of activity tied to trading, new launches, or temporary fee surges, while the more stable periods show a consistent baseline of usage that underpins its $19.7M annual total.
For BNB, this steady revenue flow suggests that its core user base continues to drive activity even outside of peak periods. If future upgrades or ecosystem events can build on this foundation, it could help turn those one-off spikes into a stronger, more sustained revenue trend through the second half of 2025.
To sum up
If there’s one takeaway from all this, it’s that the second half of 2025 is shaping up to be interesting rather than predictable. Across Bitcoin, Ethereum, XRP, Solana, and BNB, the signals we’ve looked at—whether it’s moving averages, profit levels, transaction counts, or network revenue—all point to steady momentum backed by real usage and supportive market structure. None of these metrics are guarantees, but they suggest that the market’s foundation is firmer than it’s been in a while.
Bitcoin and Ethereum continue to set the tone, holding strong above key trend lines and supported by stable whale activity and ETF inflows. XRP and Solana show signs of renewed energy, with both technical and on-chain data hinting at room for growth if they can hold their ground. BNB rounds out the list with steady price action and consistent revenue that underscores its underlying network strength.
In other words, if you’re looking for coins to buy and hold through H2 2025, these five remain the most compelling blend of established track records and active fundamentals. But as always, keep an eye on the same indicators analysts track—momentum shifts can happen quickly, and staying informed is your best hedge against surprises.
Disclaimer
This article is provided for informational purposes only and does not constitute legal, financial, or professional advice. All content is based on publicly available information and personal opinions. Readers should seek professional guidance before making decisions or acting based on the material presented. The author and publisher assume no liability for any actions taken or not taken by the reader based on the information contained herein.


 15 min584
 8 min849
 15 min1.3K
 12 min1.3K
 14 min1K
 29 min703
 22 min1.6K
 17 min1.4K
 10 min1.6K
 12 min66715 min5848 min849